

Digital Vision Chart
Digital Vision Chart: Modern Tool for Accurate Vision Testing
A Digital Vision Chart is an advanced electronic tool used by optometrists to assess visual acuity and diagnose vision problems. With customizable displays, remote control operation, and dynamic adjustments for brightness and contrast, it provides a more accurate and efficient alternative to traditional eye charts. This versatile instrument can test visual acuity, contrast sensitivity, astigmatism, and binocular vision, offering a comprehensive approach to modern eye care.
Description
Digital Vision Chart
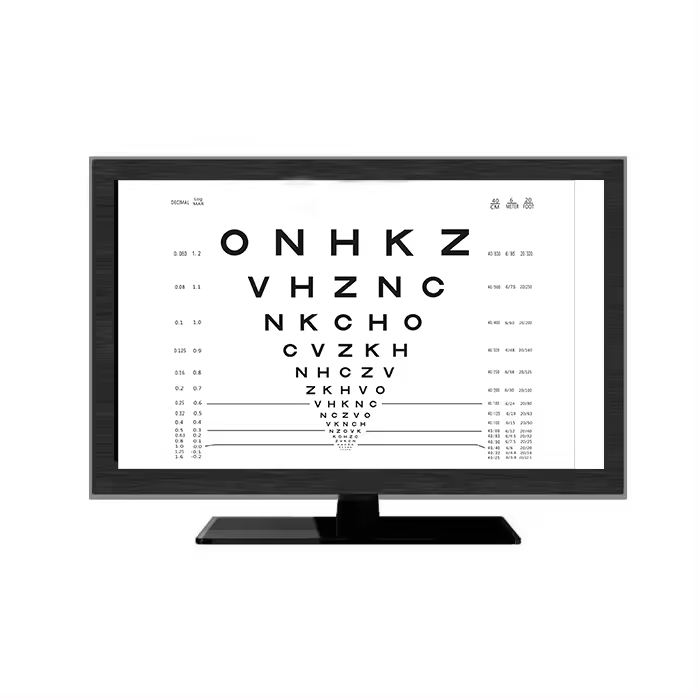
A Digital Vision Chart is an advanced, electronic tool used by eye care professionals to assess a patient’s visual acuity and diagnose vision problems. Here are some key features and aspects of a Digital Vision Chart:
- Purpose: It serves the same fundamental purpose as traditional eye charts, such as the Snellen chart, but with enhanced features and flexibility. It is used to measure how well a patient can see at various distances, which helps in diagnosing vision issues and determining the need for corrective lenses.
- Components: Typically consists of a high-resolution display screen (LCD, LED, or similar) that presents letters, numbers, or other symbols in various sizes and contrasts.
- Advantages:
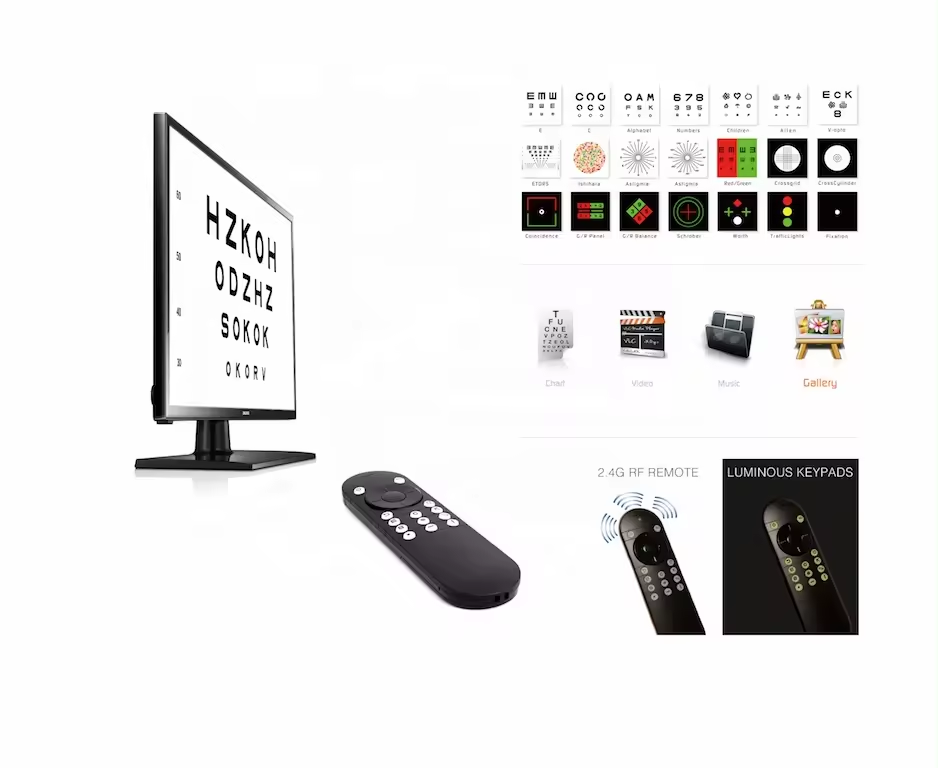
- Customizable Displays: Can easily switch between different types of charts and tests, such as Snellen charts, contrast sensitivity tests, and astigmatism charts.
- Remote Control: Often comes with a remote control or computer interface, allowing the practitioner to change the displayed content without leaving their seat.
- Dynamic Adjustments: Can adjust brightness and contrast to simulate different lighting conditions, improving the accuracy of the visual assessment.
- Interactive Features: Some digital charts include interactive features for more engaging and thorough testing, especially useful for pediatric patients or those with communication difficulties.
- Usage:
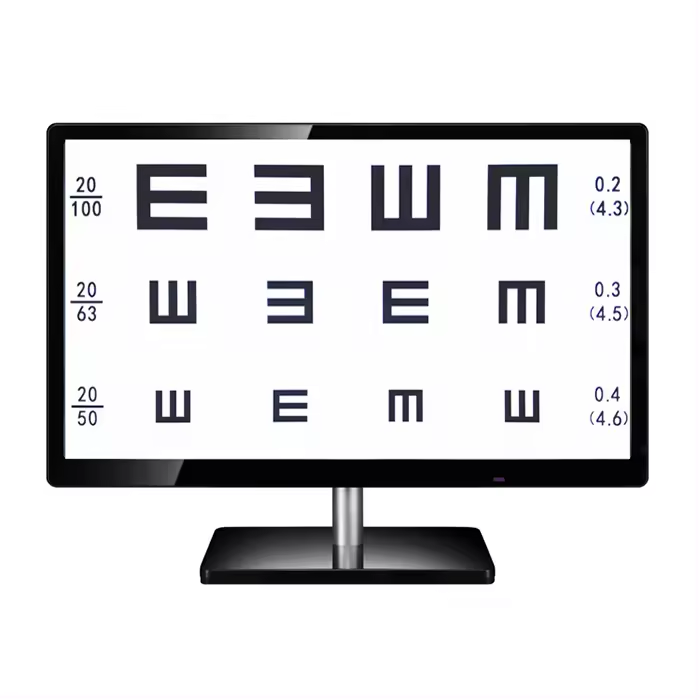
- Visual Acuity Testing: Measures how well a patient can see at different distances.
- Contrast Sensitivity Testing: Assesses the ability to distinguish between different levels of contrast, which can be important for detecting certain eye conditions.
- Astigmatism Testing: Helps in identifying and measuring astigmatism.
- Binocular Vision Testing: Evaluates how well both eyes work together.
- Integration: Can be integrated with other digital tools and systems in an eye care practice, such as electronic medical records (EMRs) and digital refractors, for a seamless workflow and more comprehensive patient care.
Overall, a Digital Vision Chart offers a modern, versatile, and efficient approach to vision testing, providing more accurate and convenient assessments compared to traditional eye charts.


Reviews
There are no reviews yet.